The previous post introduced how to identify trials whose values are outside the three standard deviations. Usually after this step, researchers will calculate the condition means and convert the data into wide format that could be used in most of the statistical software, such as Jamovi, JASP, and SPSS. These two steps will be the main focus of this post.
We will continue using the data after identifying trials outside the three standard deviations in the previous post, and you may download the data here.
With Excel (without R)
In Excel, we may use “PivotTable” to calculate the condition means. Specifically, (1) click at any cell that is part of the data; (2) navigate to the “Insert” panel and (3) then click “PivotTable”:

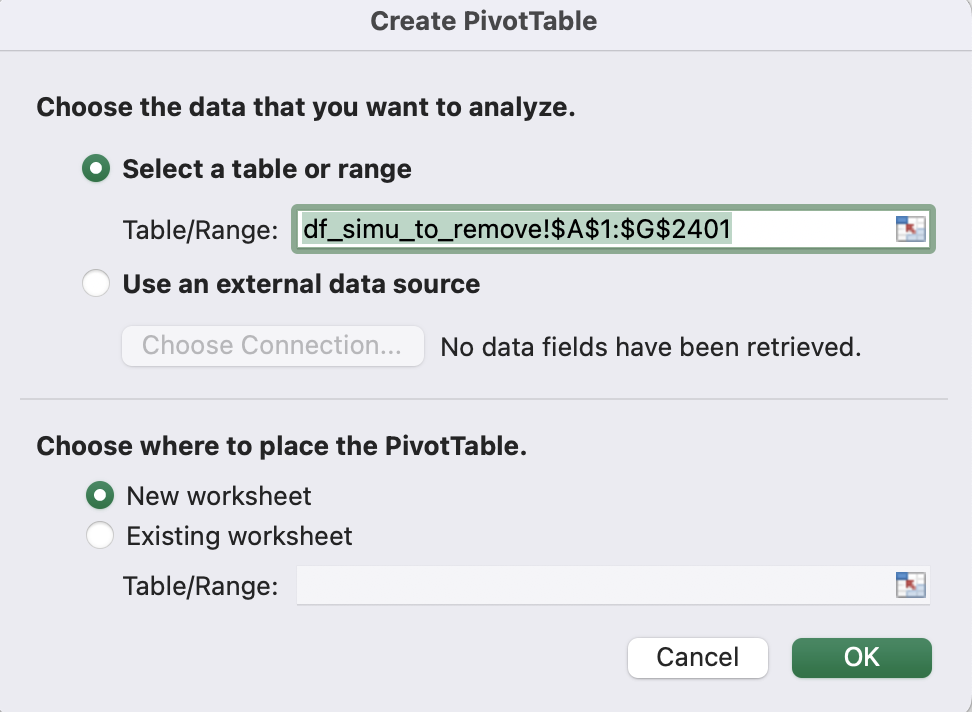
A new window will appear and you may click “OK”:
A new sheet with pivot table will be created:
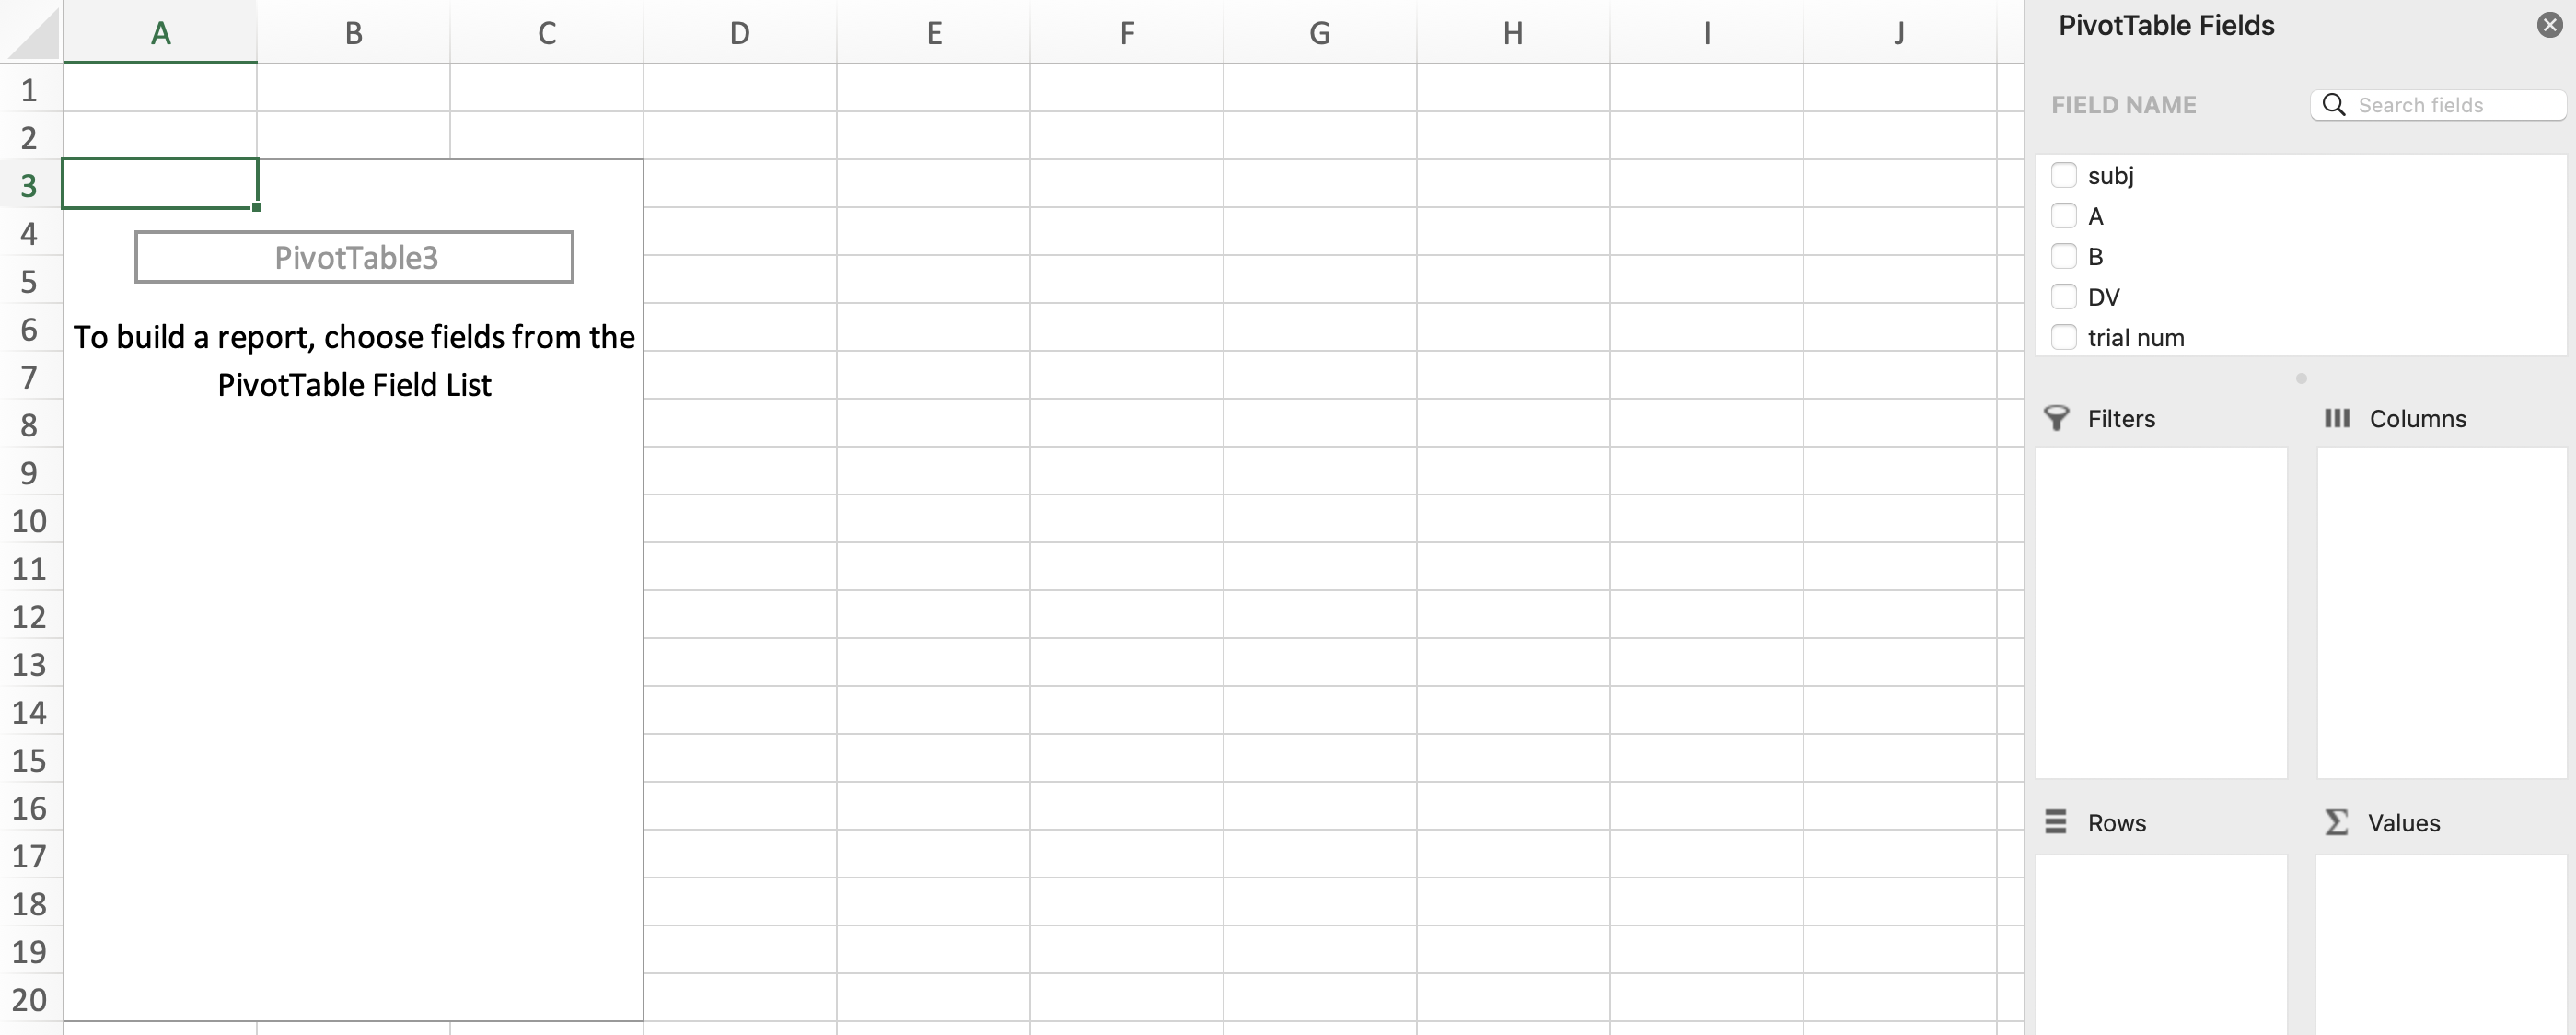 The right side will display the data. In the right side, you will find the relevant settings for the pivot table.
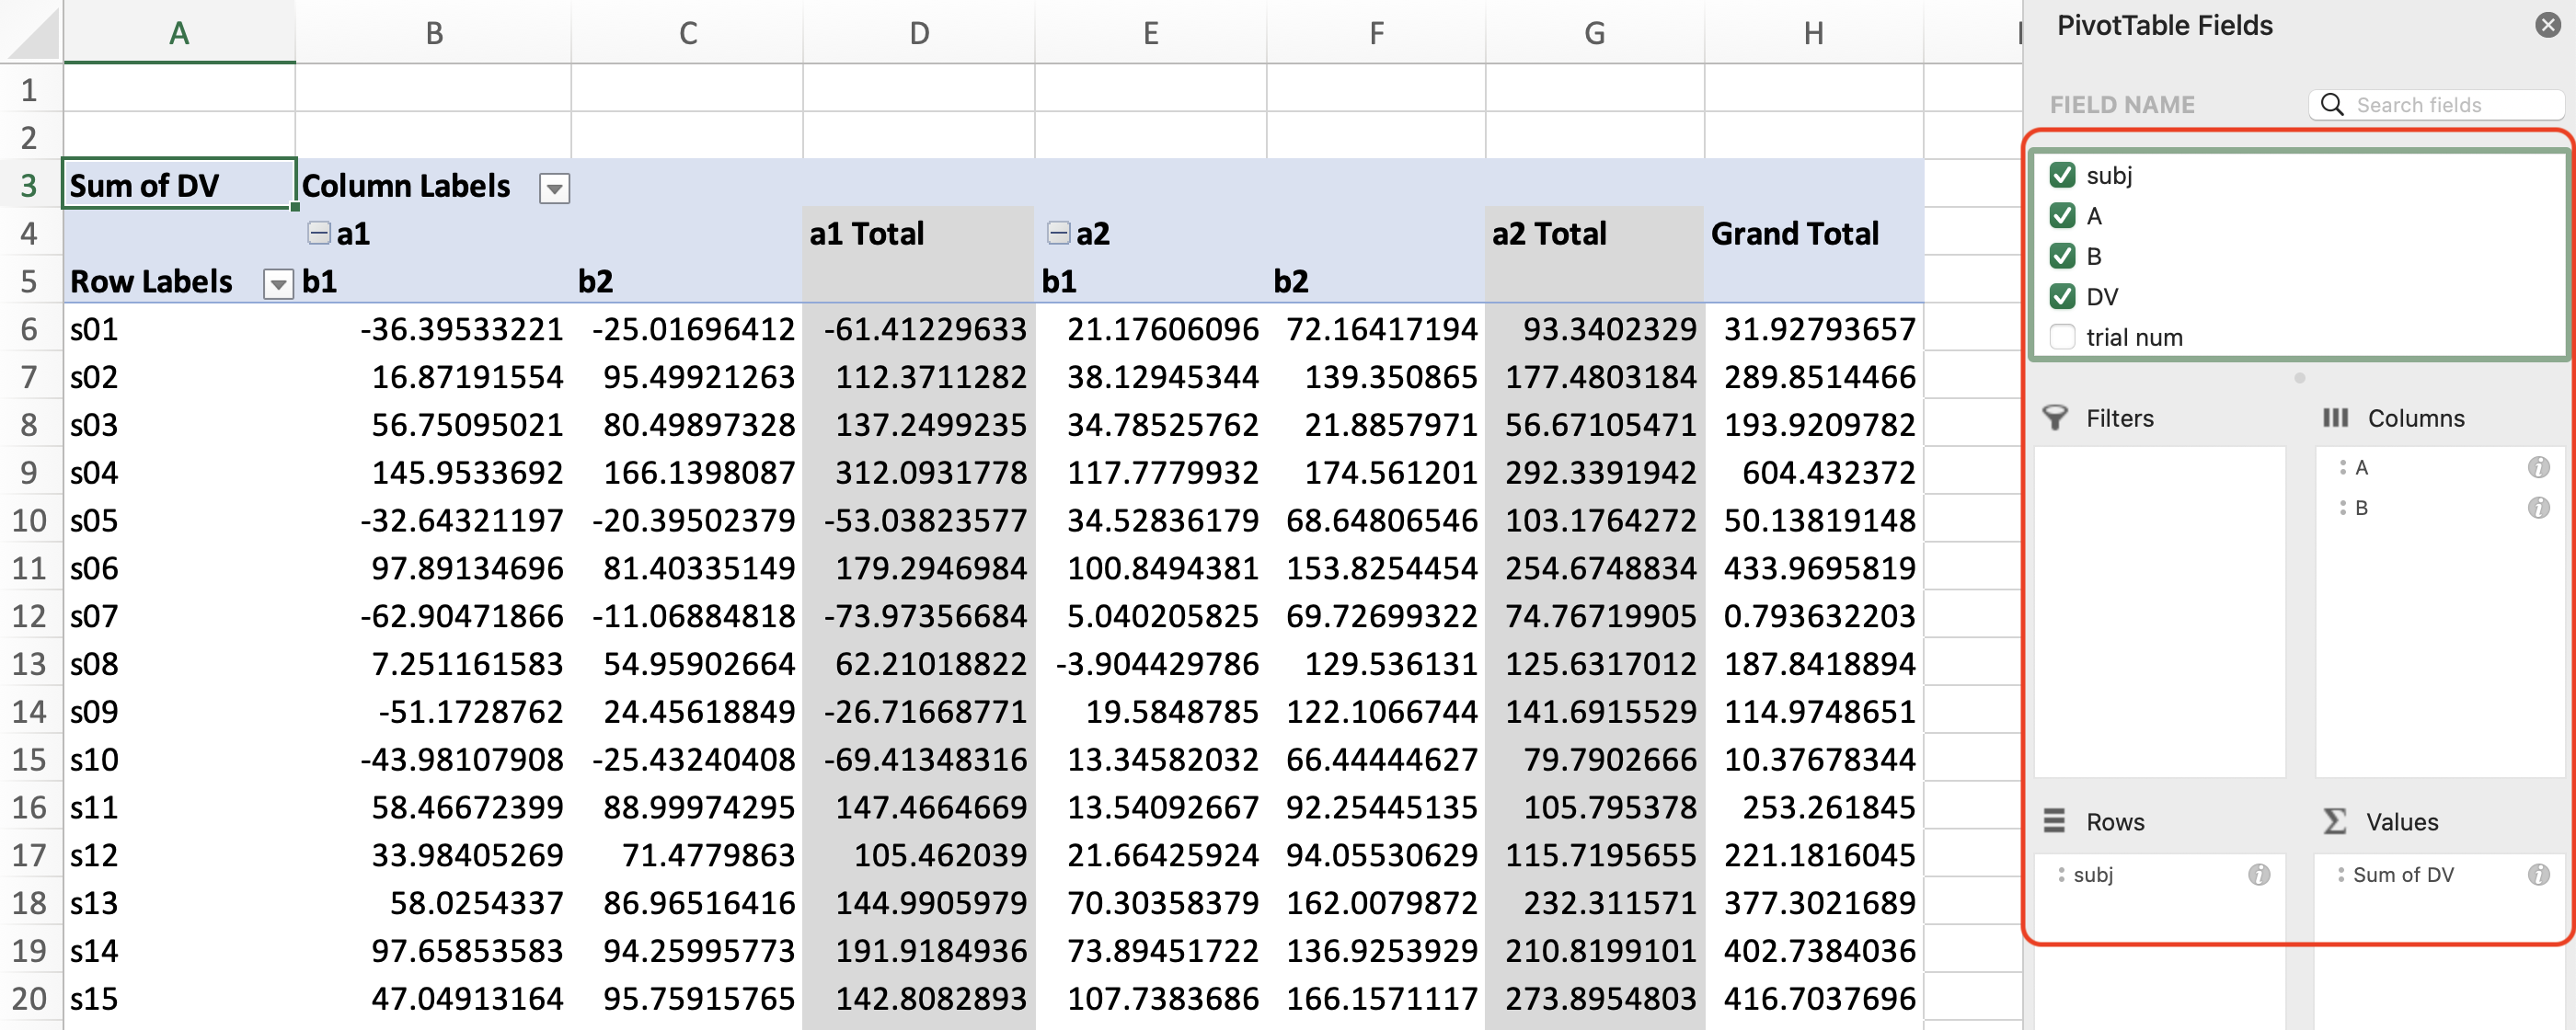
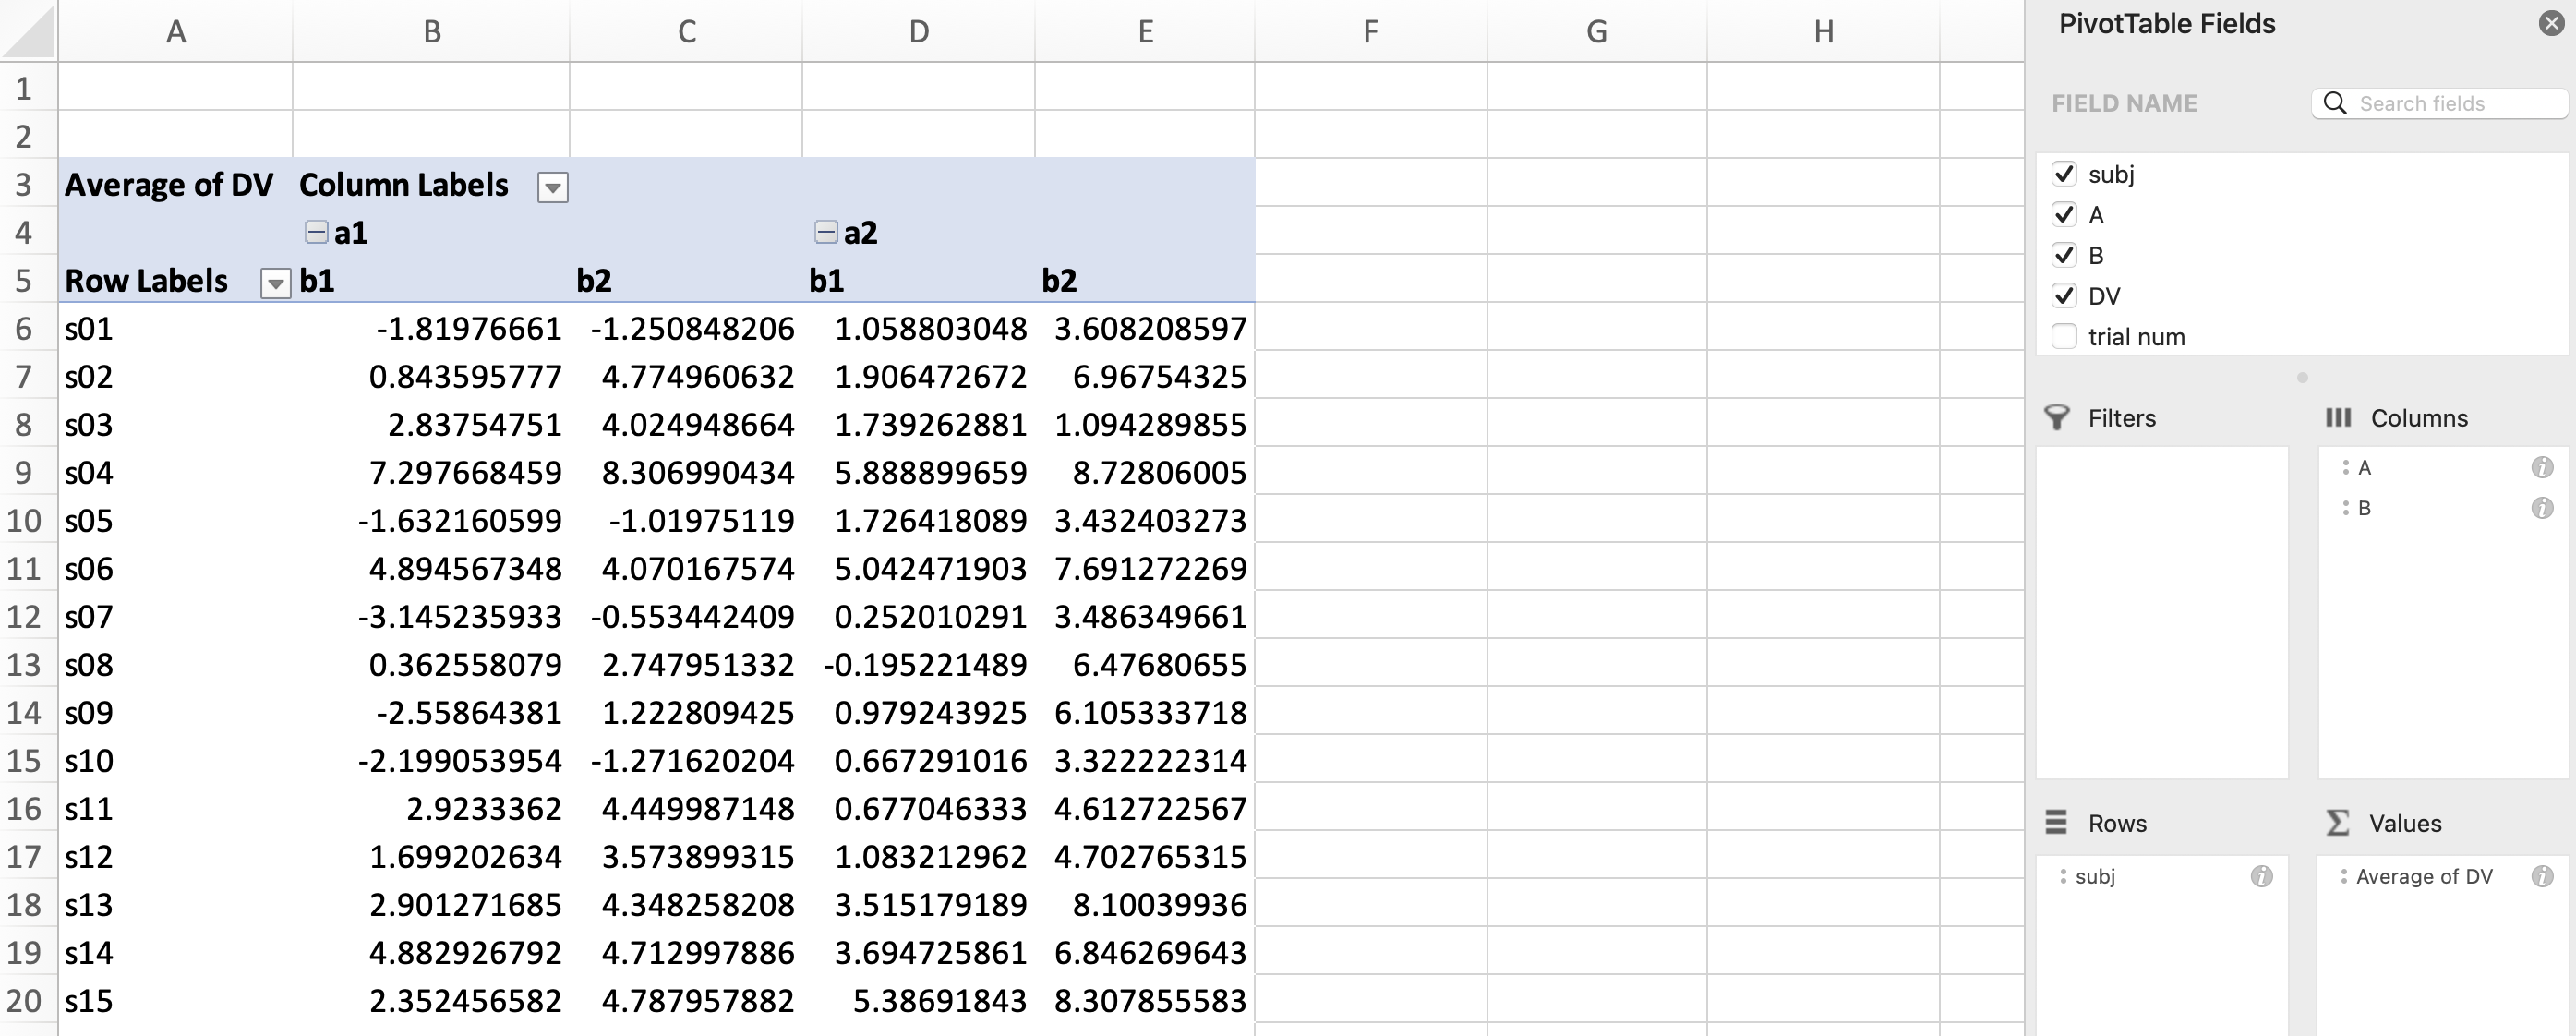
Suppose we would like to calculate the means of DV for each participant (subj) and each condition (A and B). To be compatible with most of the statistical software, each row of the resultant pivot table should correspond to one participant, and each column should correspond to one level of the conditions. Thus, we can drag the field names from “FIELD NAME” to the relevant sections: put subj into “Rows”; put A and B in “Columns”; put DV in “Values”.
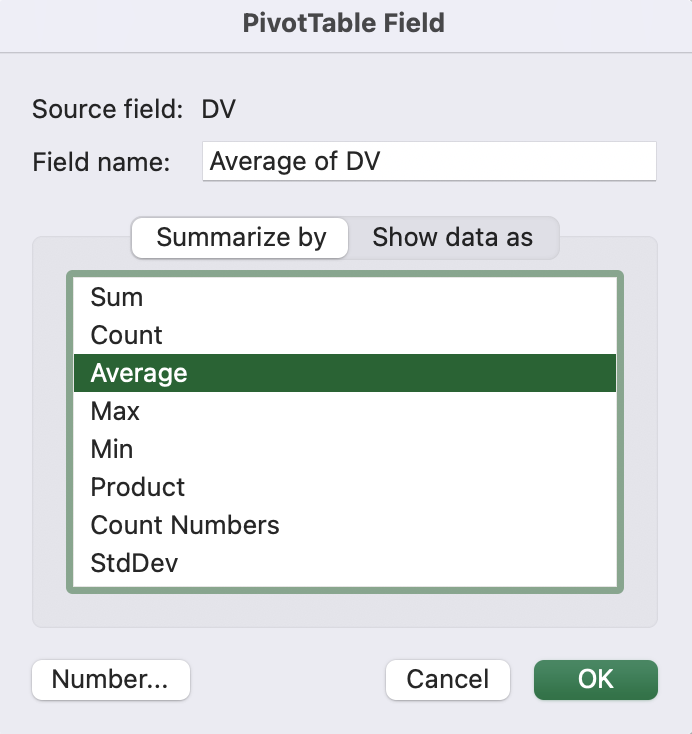
By default, the pivot table will display the “Sum” of the values (i.e., DV). To display the means, we may right click on “Sum of DV” and clik “Field Settings”:

Then, choose “Average” and clik “OK”:
 Now the pivot table should display the mean (i.e., average) of
 DV.
By default, the pivot table also displays the mean for some other conditions. For example, “a1 Total” displays the mean of DV in a1 across different levels in B. To hide these unwanted summary columns, we may right click on “a1 Total” (or “a2 Total”) and un-select “Subtotal”A”“. You may also right click on”Grand total” and select “Remove Grand Total” to hide this column.

Then you should have a tidy table:
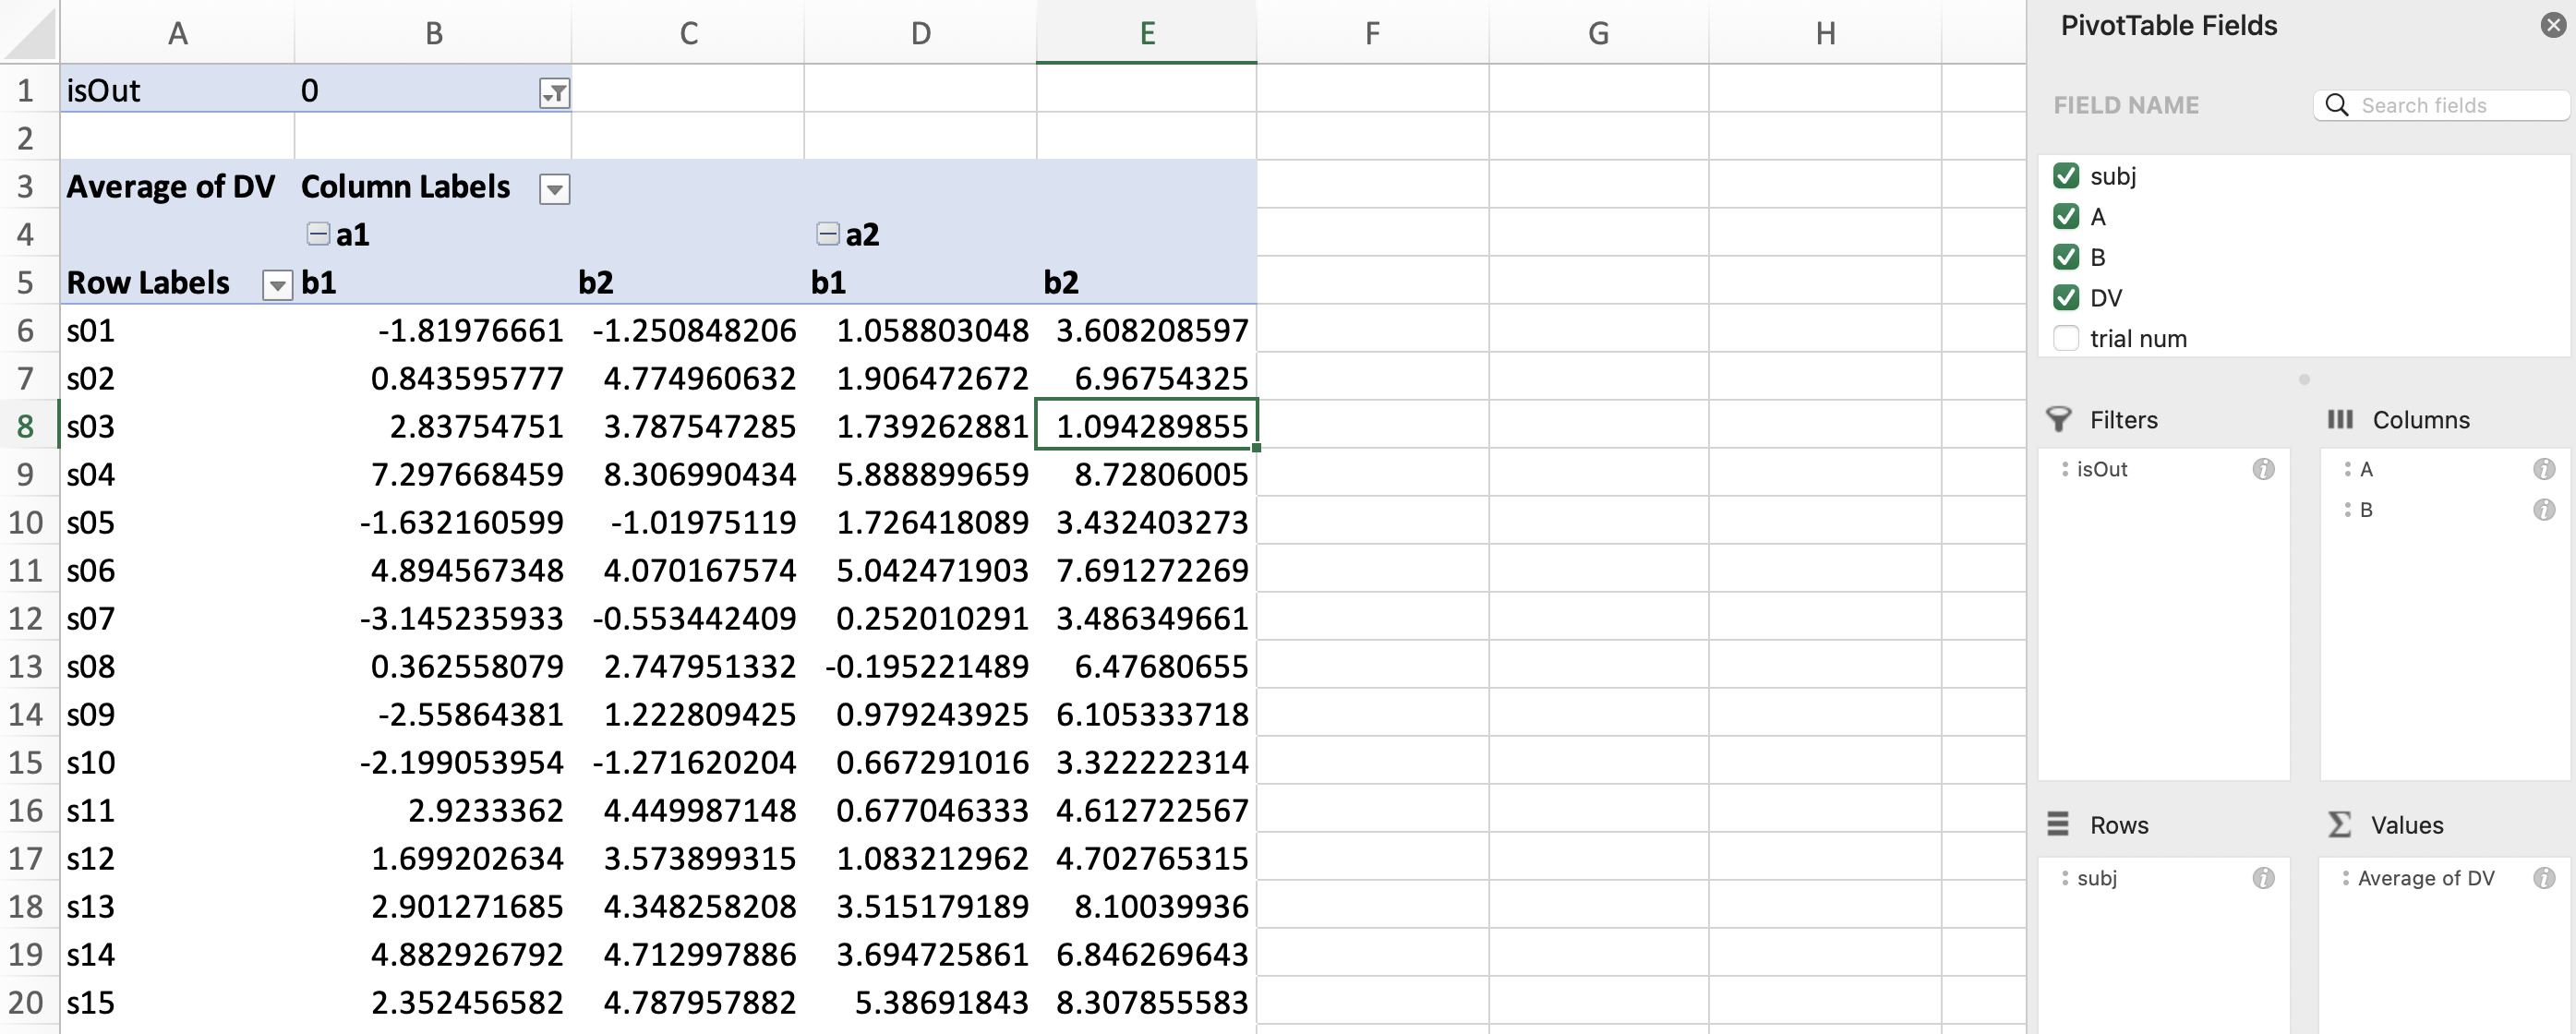
Sometimes we may only want to calculate the means of some trials, but not all trials. For instance, we may not want to include the trials whose data are outside the three standard deviations. For this purpose, we may drag the field name (i.e., isOut here) to “Filters”, and click on the filter sign and only select 0 (i.e., only keep rows whose isOut is 0):

Now, we have a (pivot) table that displays the means for each condition and each participant, where some trials are excluded.
 This table then can be copied to statistical software for further analysis.
With R
Here, we use R to calcuate the condition mean convert data into wide format.
# load libraries
library(dplyr)
library(tidyr)
We need to load the data from the previous post:
# read the data from previous post
df_simu_identified <- readxl::read_xlsx(
  file.path("..", "2023-02-20-identify-3sd", "df_simu_identified.xlsx"),
  sheet = "df_simu_identified")
Again, it only needs several lines of codes to complete the previous steps in R.
df_wide <- df_simu_identified %>%
  filter(isOut==0) %>%      # remove trials where isOut is 1
  group_by(subj, A, B) %>%  # group the data by "subj", "A", "B"
  # calculate the mean of DV for each participant and each condition
  summarize(mean_DV = mean(DV),
            .groups = "drop") %>%
  # convert data from long format to wide format
  pivot_wider(id_cols="subj",           # the participant column name
              names_from=c("A", "B"),   # all independent variables
              names_sep="_",            # string to concatenate level names
              values_from=mean_DV)      # the dependent variable

df_wide
Summary
This blog introduces how to calculate the condition means and convert data into wide format, which could be used in most statistical software. Although it is feasible to complete these steps with Excel, it is much easier to use R.