One popular pre-processing step applied to behavioral data is to remove data outside the three standard deviations (SDs). This blog introduces how to do so without and with R.
Let’s first simulate a data set with 2 (A: a1 vs. a2) \(\times\) 2 (B: b1 vs. b2) within-subject experimental design, where there are 30 participants in total and 20 trials in each condition:
library(dplyr)
library(faux)
set.seed(2023) # set seed for reproducibility
# simulate the data set
df_simu <- add_random(subj = 1:30) %>%
add_within(A = c("a1", "a2"), B = c("b1", "b2")) %>%
add_random(trial = 1:20) %>%
add_contrast("A", "difference", colnames = "A_sdif") %>%
add_contrast("B", "difference", colnames = "B_sdif") %>%
add_ranef("subj", s_int=2, s_slo_A=2, s_slo_B=2, s_slo_AB=2) %>%
add_ranef(sigma = 1) %>%
mutate(DV = 3 + s_int +
(2 + s_slo_A) * A_sdif +
(2 + s_slo_B) * B_sdif +
(2 + s_slo_AB) * A_sdif * B_sdif +
sigma) %>%
select(subj, A, B, DV)
# save the simulated data locally
write.csv(df_simu, "df_simu_to_identify.csv", row.names=FALSE)You may download the simulated data here.
With Excel and SPSS (without R)
Let’s first identify the trials whose values are outside the three SDs with Excel and SPSS.
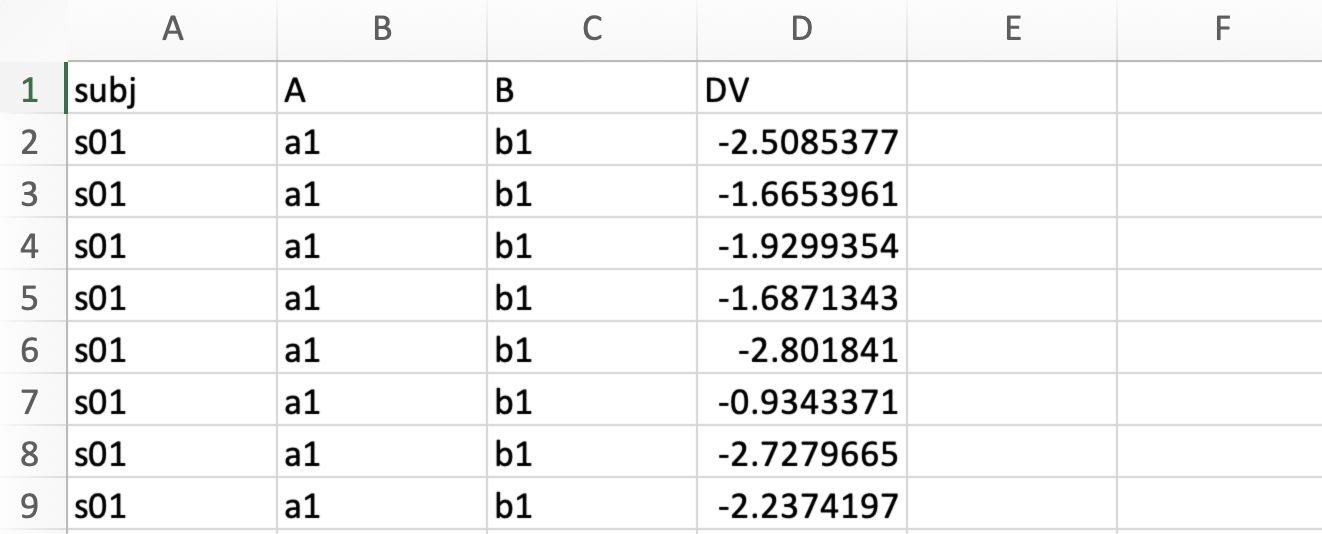
When opening the simulated data in Excel, you should see something like this:
 The four columns are the subject names (
subj), independent variables A (A) and B (B), and the dependent variable (DV).
First of all, we need to create a new column for later usage. Here, I created a column called trial num and saved a list of integers starting from 1. The specific steps are (1) inputing 1 and 2 in the second and third rows in the trial num column, (2) moving the cursor to the right bottom corner of the cell where you input 2, (3) and when the cursor becomes a intact crossing (see figure below), double click with the mouse.

After the steps above, you should have a new column of integers starting from 1 to the very last row (see below). Later we can use this column to make sure the order of the trials is as expected.

Next, we can copy the data into SPSS, and you should see something like this:

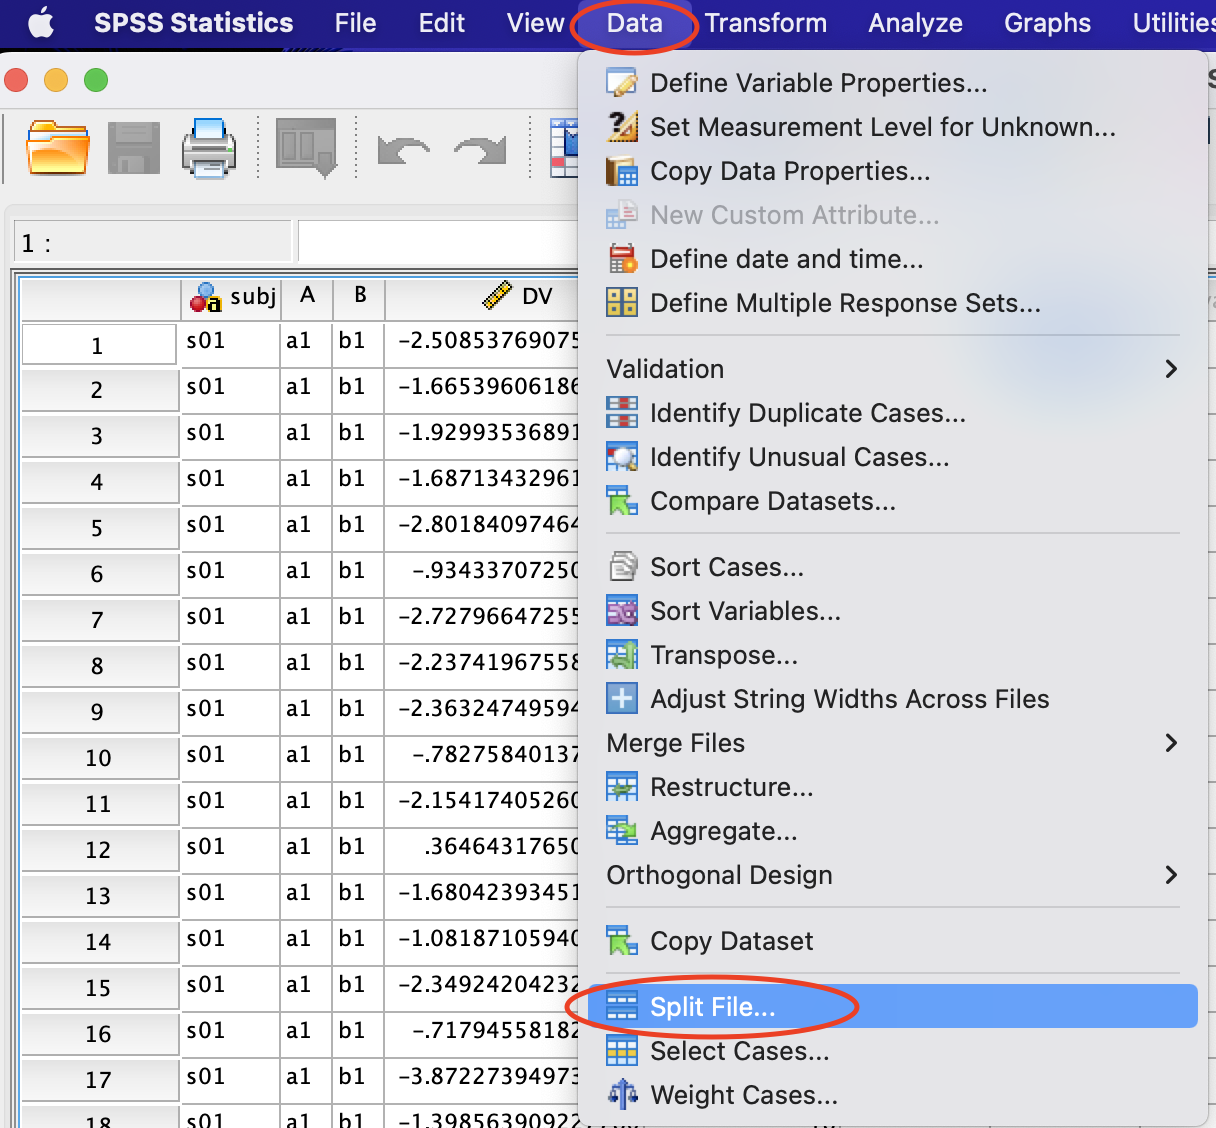
Suppose we would like to identify the trials whose values are outside the three SDs for each participant and each condition, separately. Therefore, we need to split the data by subj and independent variables (A and B). We can achieve this by selecting Data -> Split File...:
Then a new window will appear:
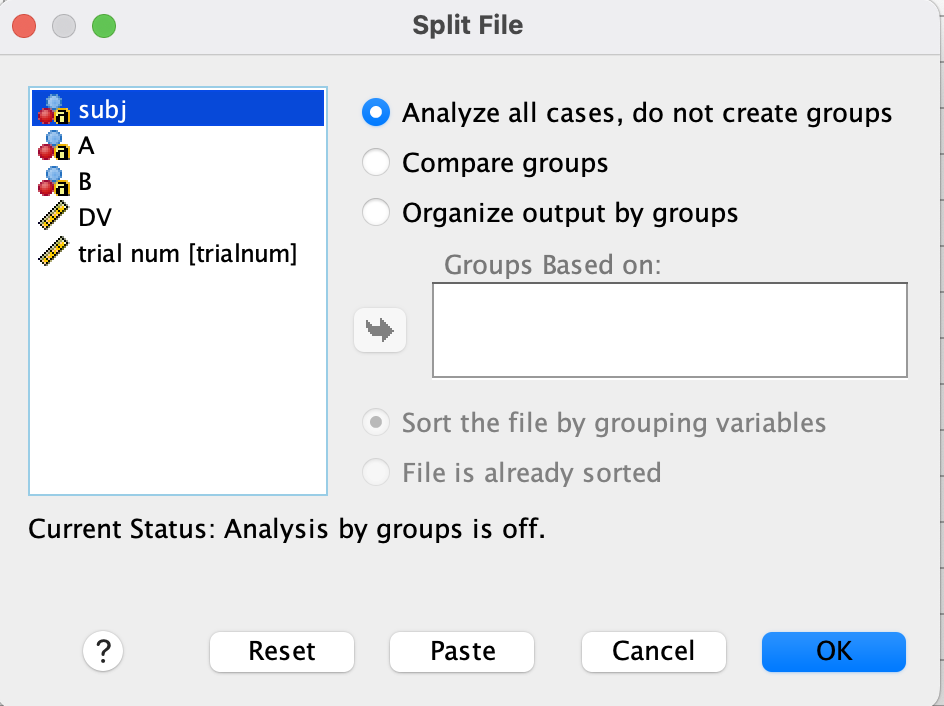
You need to add all the relevant columns (i.e., subj, A, and B here) into Groups Based on:;
 The data now should be sorted firstly by
 subj and then by A and B. (Since our data were already sorted by these three columns when they were created, we would not notice any difference here.)
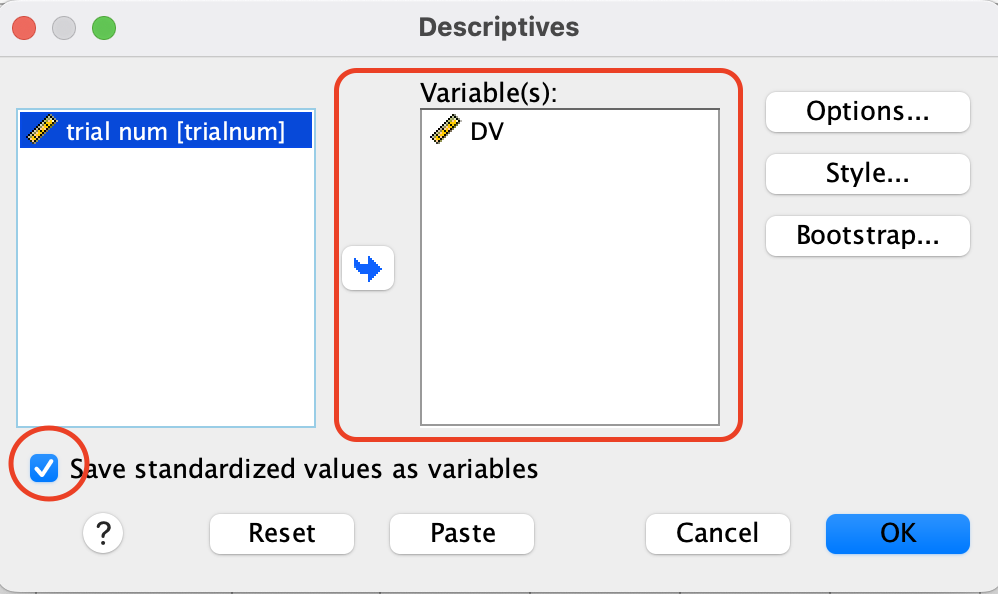
Next, we need to calculate the SDs of the dependent variable on each trial (for each subject/participant and each condition, separately). Click Analyze -> Descriptives...:

A new window will appear. We need to select Save standardized values as variables and add DV to Variable(s)::
A new column called ZDV will be created (Z will be added to the column name, i.e., DV here):
 The
The ZDV column is the SDs of the dependent variable within each participant and each condition.
Then we can identify which trials are outside the three SDs by selecting Transform -> Compute Variable...:
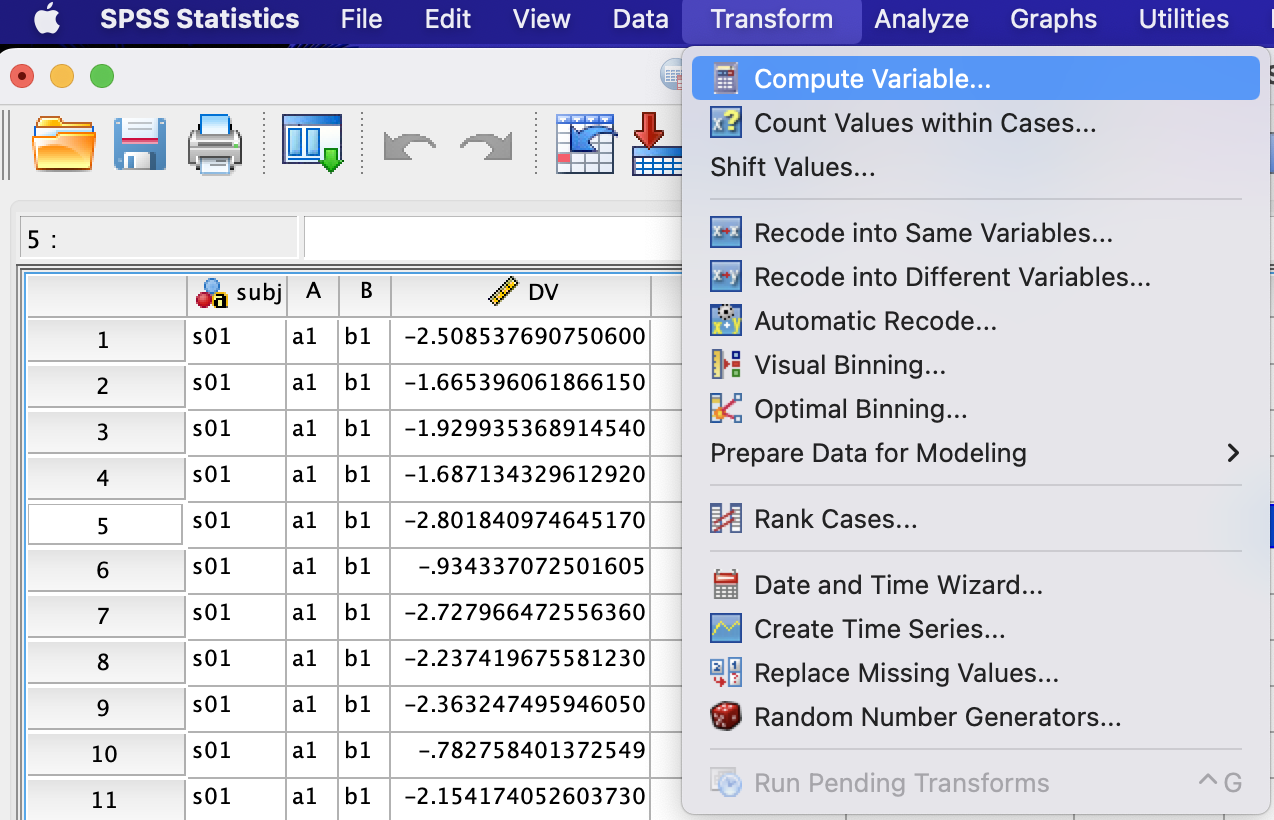
We can set the new column name (i.e., isOut here) and input the formula to calculate whether the ZDV is smalller than -3 or larger than 3:
 Then we got a new column called
 isOut, where 1 means that trial is outside the three SDs.
Since the order of the trials in SPSS was sorted when we Split File... earlier, the trial order here may not match that in Excel. Thus, we need to sort the trial order here to match that in Excel before copying data from SPSS back to Excel. We can do so by selecting Data -> Sort Cases...:
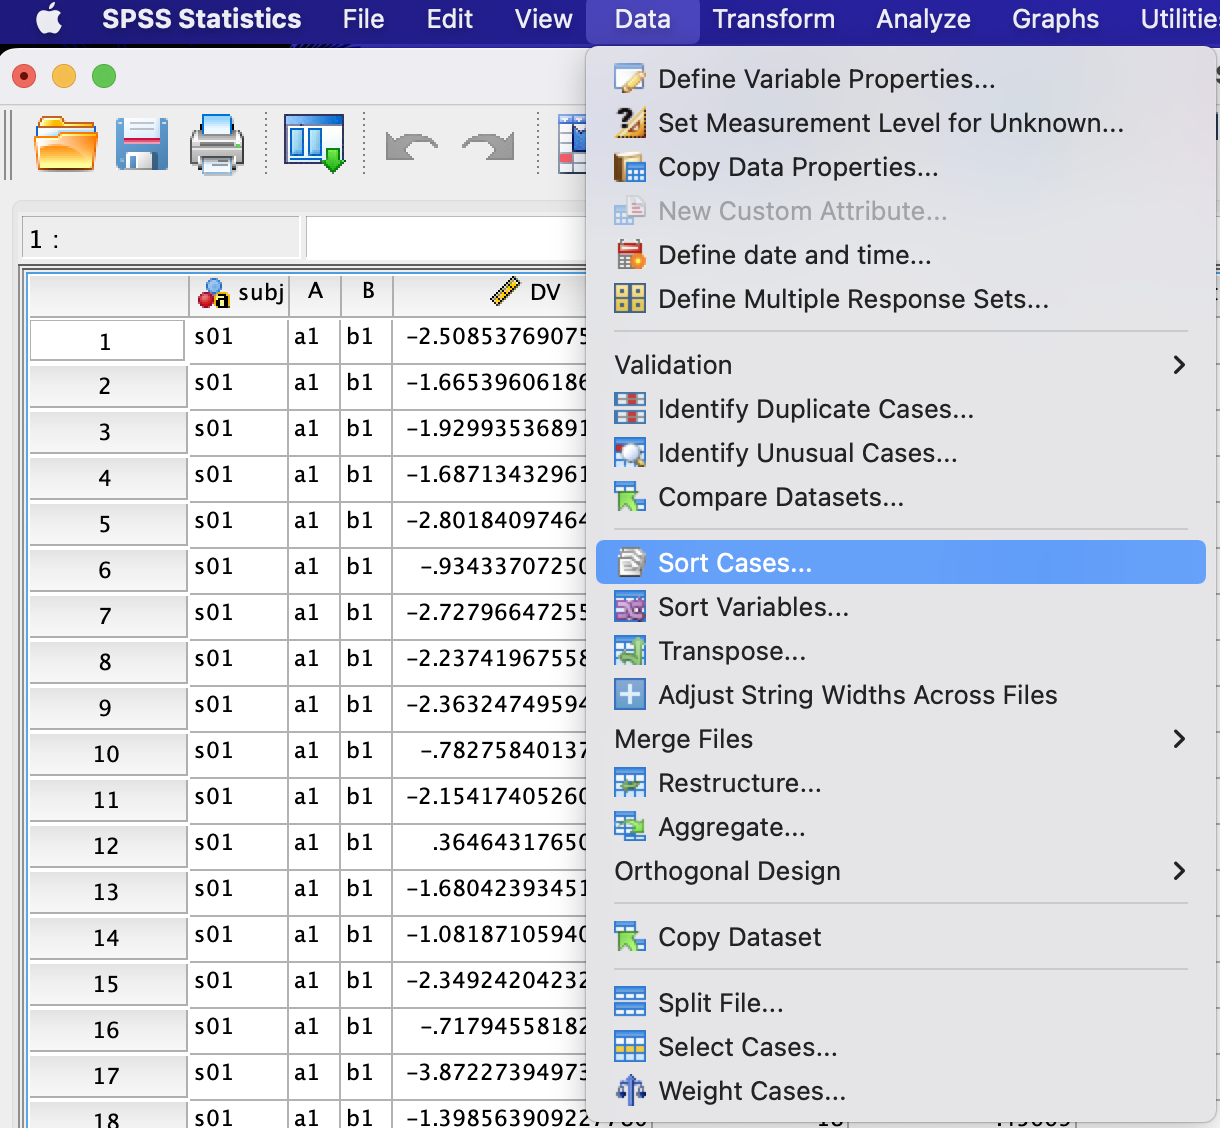
A new window will appear. Add trialnum to Sort by: and make sure Ascending in Sort Order is selected:

After matching the trial orders in SPSS and Excel, we may copy the newly created columns in SPSS to Excel (i.e., ZDV and isOut here):
 Now we have calculated the SDs of dependent variables on each trial (
ZDV) and identified trials whose values are outside the three SDs (isOut). You may use isOut later in the pivot table to filter out these trials.
For now, we may check the trials whose values are outside three SDs by filtering out isOut:
 As shown in the image above, we identified two trials whose values are outside three SDs.
With R
Comparing to using Excel and SPSS, it is much easier to identify trials outside three SDs with R:
df_3sd <- df_simu %>%
  group_by(subj, A, B) %>%   # equivalent to `Split File...`
  mutate(ZDV = scale(DV),    # equivalent to `Save standardized values as variables`
         isOut = as.numeric(ZDV < -3 | ZDV > 3)) # equivalent to `Compute Variable`

head(df_3sd, 8) # only show the first 8 rows
We may also only check the trials whose values are outside three SDs:
# only show trials whose values are outside three SDs
df_3sd %>%
  filter(isOut==1)
Same as using Excel and SPSS, the same two trials were identified outside the three SDs with R.
Summary
This blog introduced how to identify trials whose values are outside three SDs within each participant and each condition separately. These steps could easily generalize to identifying participants whose means are outside three SDs, where the condition means for each participant should be calculated first and data should be Split File... only by subj.
Of the two approaches in identifying trials outside three SDs, using R is much easier.